Global Energy Transitions Stocktake
Tracking progress toward the Paris Agreement
This year marks the finalisation of the first global stocktake of the Paris Agreement, which assesses the world’s collective progress against its climate goals. In support of that important effort, the IEA is bringing together all of its latest data and analysis on clean energy transitions in one place, making it freely accessible to citizens, governments, and industry.
Reaching net zero emissions requires a complete transformation of how we power our daily lives and the global economy. The IEA's Net Zero by 2050 Scenario lays out a narrow but achievable pathway to net zero emissions in the energy sector by mid-century – a trajectory consistent with limiting global temperature rise to 1.5oC. Following this pathway represents the world’s best chance of avoiding the worst effects of climate change, and requires accelerating the shift to non-emitting sources of energy, such as wind and solar; increasing energy efficiency; electrifying transport, industry and buildings; expanding the use of clean hydrogen and other low-emission fuels; and investing in emissions abating technologies, including negative emission technologies.
The IEA’s Global Energy Transitions Stocktake pulls together the latest data and analysis on the global clean energy transition, including energy sector greenhouse gas emissions, technology developments, energy sector financing, energy access and energy employment. Taken together, these indicators allow us to track global progress of the energy transition and provide an accurate and objective picture of where we are now, and the trajectories we are on.
This page, which will be regularly updated in the lead up to the UN's COP28 climate change conference, includes a calendar of all major report launches throughout the year, making it easy to follow the latest updates and find links to IEA’s publications and in-depth analysis. This series culminates in the release of a new Special Report on Climate which will explore viable pathways in the energy sector to 1.5oC.
Upcoming events and releases
|
Month |
Release |
|---|---|
|
October |
|
|
November |
The Oil and Gas Industry in Net Zero Transitions |
Global tracking indicators
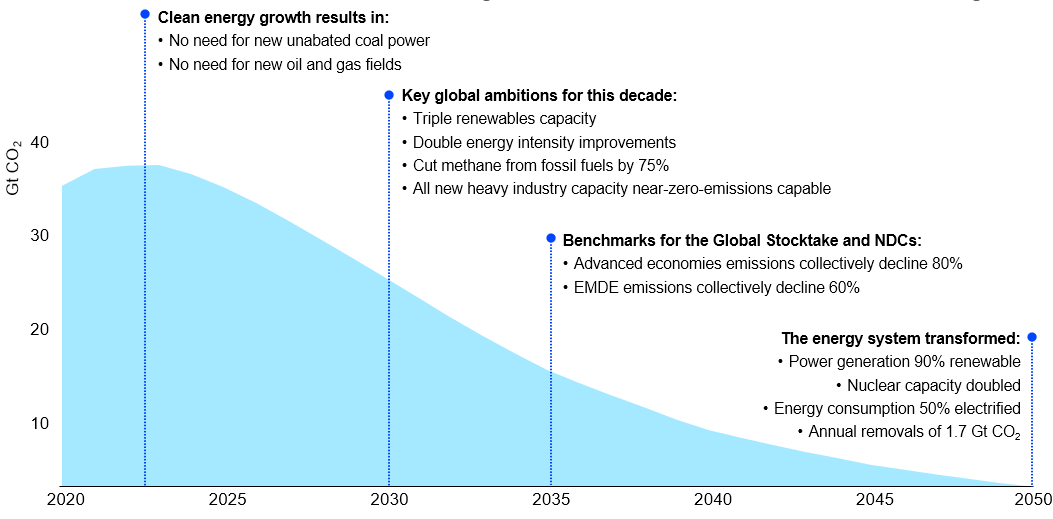
The path to 1.5 ̊ C has narrowed, but clean energy growth is keeping it open
But delivering net zero emissions will require larger, smarter and repurposed electricity networks; large quantities of low-emissions fuels; more nuclear power; and scaling up near zero emissions materials production. And, as part of an equitable pathway, almost all countries need to bring forward their targeted net zero dates.
By 2035, emissions need to decline by 80% in advanced economies and 60% in emerging market and developing economies compared with 2022 levels.
Explore the Net Zero Roadmap: A Global Pathway to Keep the 1.5 ̊ C Goal in Reach
Low emission hydrogen production by technology route and maturity based on announced projects and in the Net Zero Scenario, 2030
OpenMomentum around low-emission hydrogen keeps growing, but progress is still hampered by cost challenges and uncertainty around demand
Greater efforts are particularly needed to stimulate demand for low-emission hydrogen, which still accounts for less than 1% of global hydrogen production and use, and will need to grow more than 100-fold by 2030 to meet the IEA’s Net Zero Emissions by 2050 Scenario.
Number of people without access to electricity by region, 2010-2023
OpenProgress on electricity access has remained slow in 2023, hobbled by financial strains
Recent IEA data and analysis suggest that in 2023 progress on expanding has access has resumed but is still below pre-pandemic levels, with solar home systems playing a major role. This update comes in parallel with an update to all of IEA's latest data on Sustainable Development Goal 7: ensuring affordable, reliable, sustainable and modern energy to all.
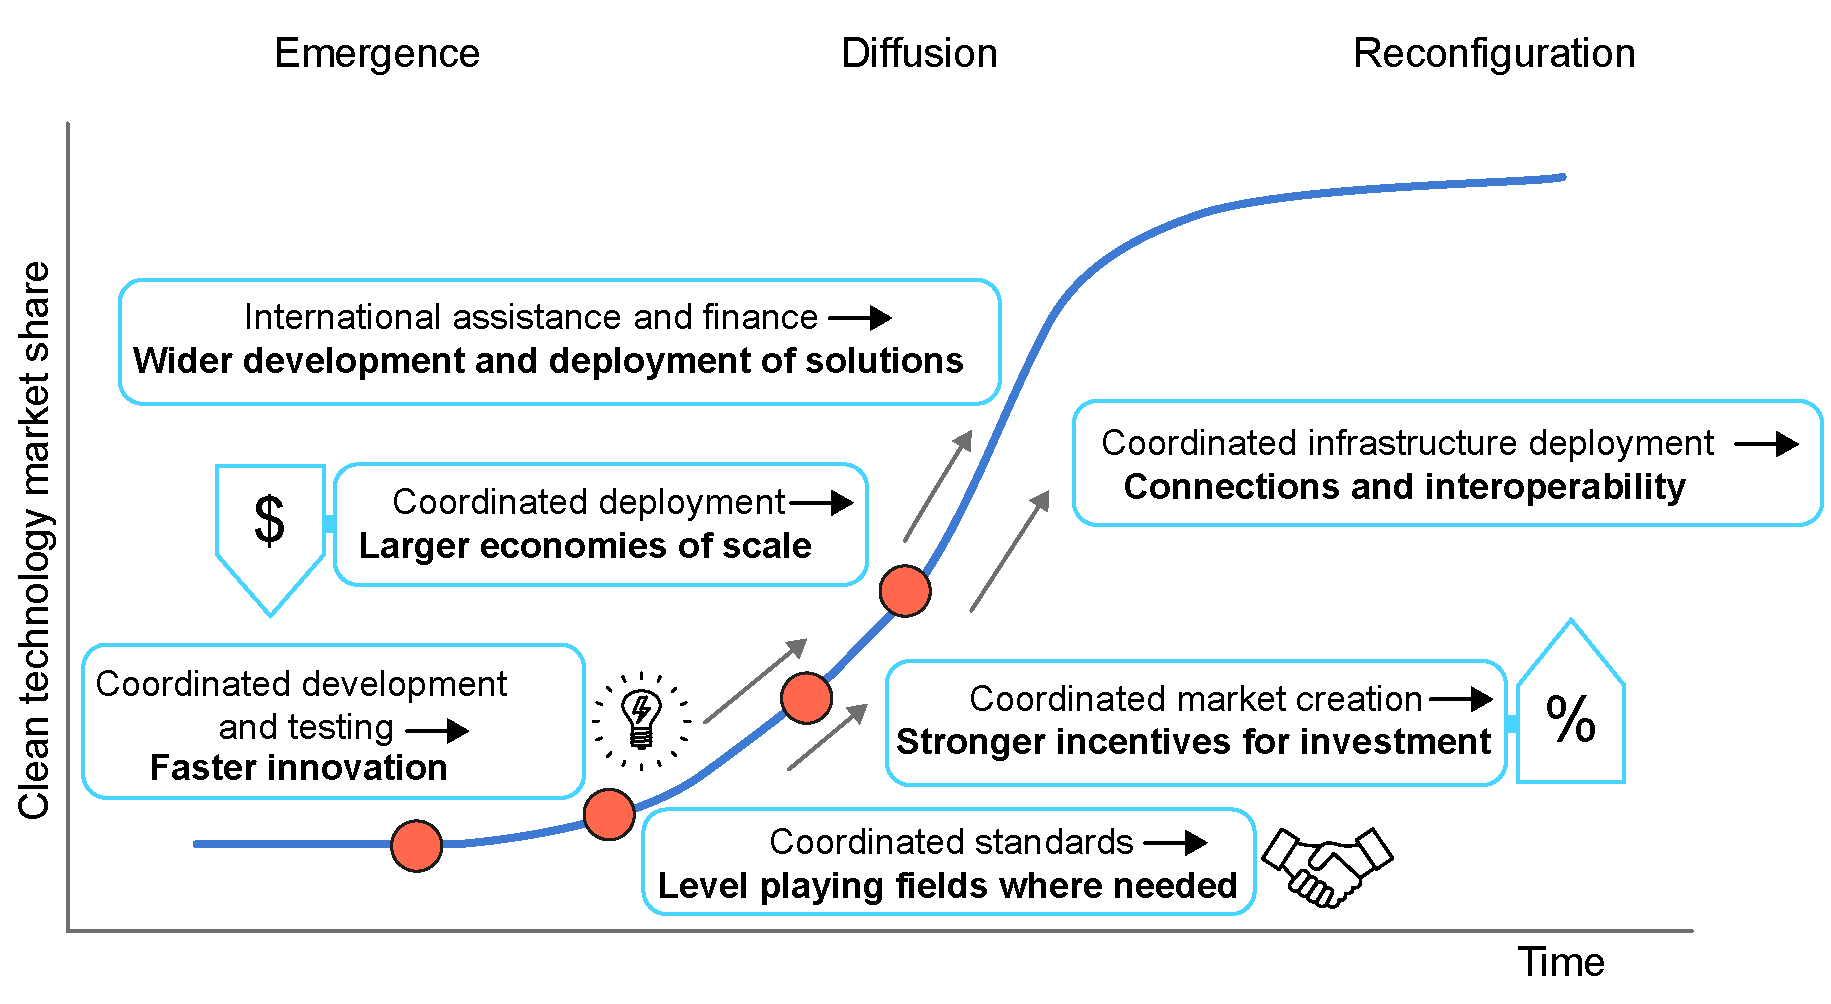
Stronger international cooperation in high emissions sectors crucial to get on track for 1.5C climate goal
The clean energy economy is gaining ground, but greater efforts are needed
Clean energy investment in emerging and developing countries (excluding China) in the Net Zero Scenario, 2019-2035
OpenClean energy investment in emerging markets and developing countries needs to grow steeply to reach SDGs and climate goals
Scaling Up Private Finance for Clean Energy in Emerging and Developing Economies
Government spending for clean energy investment support and crisis-related short-term consumer energy affordability measures, Q2 2023
OpenGovernments have allocated USD 1.34 trillion to clean energy since the pandemic
In addition, policymakers have spent a further USD 900 billion in efforts to protect households and businesses from rising energy bills since autumn 2021. Only about 25% of these short-term affordability measures were targeted toward households most in need of support or businesses most exposed to the effects of high energy prices. Without better targeting, new affordability measures will further contribute to rising levels of government debt.
Global energy investment in clean energy and in fossil fuels, 2015-2023
OpenClean energy investment reaches record high in 2022
Renewable electricity net annual capacity additions, 2017-2022
OpenRenewable capacity additions grew by 13% in 2022
Global additions of hydropower grew, owing to several large projects in Asia, while bioenergy production for power generation also declined due to the phaseout of subsidies in China, the world’s largest market. For geothermal and CSP technologies, global annual market growth remained small but stable.
Global public energy RD&D budget, 2015-2022
OpenPublic investment in energy-based research and development grew in 2022
Announced project throughput and deployment for key clean energy technologies in the Net Zero Scenario, 2030
OpenClean energy supply chains expand substantially in 2022
Read the report: The State of Clean Technology Manufacturing
Global electric car stock, 2010-2022
OpenEVs now close to 15% of global car market
A growing number of EV policies, such as the Inflation Reduction Act and new EU CO2 standards for cars and vans are driving the outlook for EV sales up, EV costs down, and and are leading to substantially less oil demand by the end of this decade. Around 500 models of electric cars were available to consumers in 2022, and supply chains continue to grow, especially for EV battery production, which is now responsible for 60% of global lithium demand, 30% of cobalt and 10% of nickel.
Annual growth in sales of heat pumps in buildings worldwide and in selected markets, 2021 and 2022
OpenGlobal heat pump sales continue double-digit growth
Global CO2 emissions from energy combustion and industrial processes, 1900-2022
OpenCO2 Emissions in 2022: Growth in emissions lower than feared
In a year marked by energy price shocks, rising inflation, and disruptions to traditional fuel trade flows, global growth in emissions was lower than feared, despite gas-to-coal switching in many countries. Increased deployment of clean energy technologies such as renewables, electric vehicles, and heat pumps helped prevent an additional 550 Mt in CO2 emissions.
Global methane emissions from the energy sector, 2000-2022
OpenMethane emissions remained stubbornly high in 2022
Energy-related and process CO2 emissions by scenario, 2010-2050
OpenMeeting all net zero pledges on time and in full would result in 1.7 °C of temperature rise in 2100
However, neither would be enough to keep the temperature rise to “well below 2 °C" nor reflect efforts “to limit the temperature increase to 1.5°C above pre-industrial levels.” In the Net Zero Emissions by 2050 (NZE) scenario, CO2 emissions drop to zero in 2050 with temperature rise peaking below 1.6 °C around 2040, before falling to around 1.4 °C in 2100.
Operational and planned carbon capture capacity by status, 2022-2030
OpenCCUS set to expand rapidly if all planned projects come online
Global CO2 emissions changes by technology maturity category in the Net Zero Scenario, 2050 compared to 2030
OpenHalf the emission reductions needed to reach net zero come from technologies not yet on the market
Energy employment in fossil fuel and clean energy sectors, 2019-2022
OpenClean energy employs over 50% of total energy workers
Country-level tracking indicators
Moving to sustainable energy systems is a global challenge that involves a multitude of decisions taken at national and local levels. Not every country starts from the same position, and not every country can or will seek the same solutions. That will depend on the structure of its economy, its legacy energy mix, and factors such as climate and geography.
Related analysis
-

Net Zero Roadmap: A Global Pathway to Keep the 1.5 °C Goal in Reach
2023 Update
-
Global Hydrogen Review 2023

-

SDG7: Data and Projections
Access to affordable, reliable, sustainable and modern energy for all
-
Breakthrough Agenda Report 2023

-
Empowering people – the role of local energy communities in clean energy transitions


Commentary — 09 August 2023
-
Scaling Up Private Finance for Clean Energy in Emerging and Developing Economies
-
Did affordability measures help tame energy price spikes for consumers in major economies?


Commentary — 02 June 2023
-
Government Energy Spending Tracker
June 2023 update